Test Info / FAQ
1. Rolling Resistance

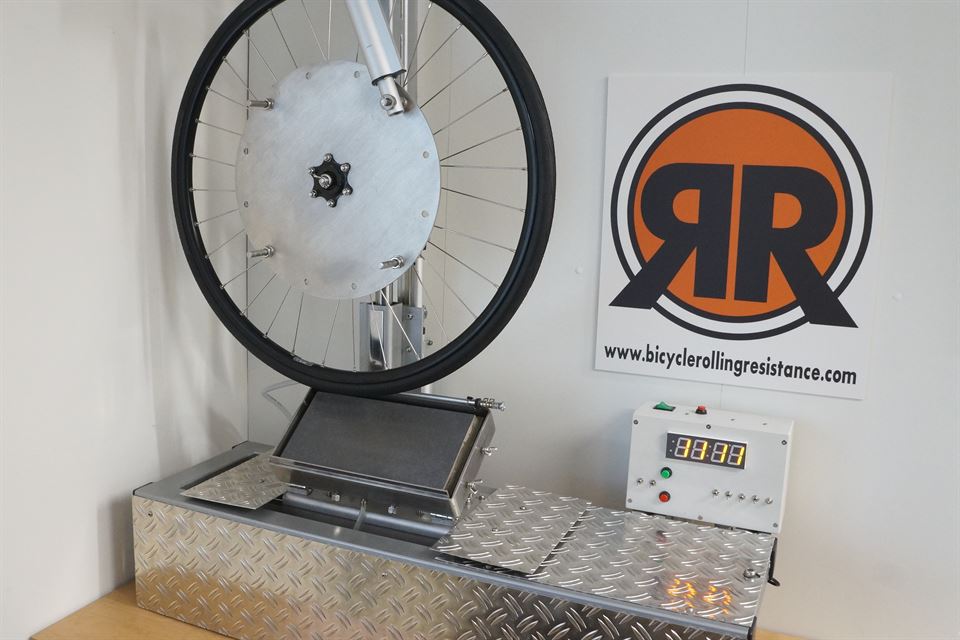
We test all tires on a rolling resistance test machine with a 77 cm drum and a DC electric motor. The drum is covered with diamond plate to simulate an average road surface.
The test machine runs on custom software and hardware designed specifically for measuring the rolling resistance of bicycle tires. Our setup calculates the average power required to keep the drum at a set speed for 30 seconds, resulting in a very accurate rolling resistance measurement.
After a warm-up period of 30 minutes, three measurements per air pressure are recorded. We then calculate the average of these three runs. After a correction for the electric motor efficiency and subtraction of the power required to spin the drum and wheel to the set speed, the result is the rolling resistance of the tire.
To guarantee our setup delivers consistent results over an infinite period, we have built a calibration tool to calibrate our machine to known values. The calibration tool also provides a motor efficiency mapping to calculate the rolling resistance of the tires to real watts.
For a general explanation of rolling resistance check Wikipedia.
1.1 Load, Speed, and Temperature
- Drum speed of 200 RPM, which translates to a speed of 28.8 km/h / 18 mph.
- 42.5 kg / 94 lbs load.
- Controlled temperature between 21.5-22.5 °C / 70-73 °F.
1.2 Calculating Total Rolling Resistance
All rolling resistance data we publish is for a single tire with a load of 42.5 kg / 94 lbs and a speed of 28.8 km/h / 18 mph. This is the data that comes straight from our test machine.
The total rolling resistance of an average rider with a total bike + rider weight of 85 kg / 188 lbs that averages 28.8 km/h / 18 mph will be double the rolling resistance you can find on our website.
If you're heavier than that or average higher speeds, the total rolling resistance will increase roughly linearly with the increase in weight or speed.
1.3 Comparing Categories
We follow the same protocols for all the tests, making comparing tires from different categories easy. The only exception is the air pressures we use for the tests, as bigger tires and off-road tires are generally used at lower air pressures.
The air pressure can make a small difference in some tests (size measurements, puncture resistance, and grip tests). In the rolling resistance tests, we see bigger differences as the air pressure makes a big difference here. Luckily, we test all tires at four different air pressures, and there is some overlap between the categories.
We recommend using Pro View (available to Pro Members) when comparing tires from different categories as it is specifically made for it.
1.4 Inner Tube Protocol
We changed the inner tube protocol at the start of 2023, and it affects the MTB, CX/Gravel, Tour/E-Bike, and Fat Bike categories.
1.4.1 2023+ Inner Tube Protocol
As of 2023, all tubeless, tubeless-ready, or tubeless-compatible tires are tested tubeless with sealant. Tube-type (clincher) tires are tested with a standard butyl tube.
We changed the inner tube protocol at the start of 2023 to align with the road bike category. There was a difference as tubeless road bike tires initially started as "Tubeless UST" which did not gain much traction over the now standard "Tubeless Ready" tires that are lighter and faster.
To keep the data easy to understand and compare, we recalculated the rolling resistance of tubeless-ready tires tested between 2014 and 2022 with data obtained from inner tube tests. We know this is not optimal, but we have done enough research with tubeless tires and inner tubes to know that the calculated values will come very close to the tested values.
You can still access the original test data of tubeless-ready MTB, CX/Gravel, Tour/E-Bike, and Fat Bike tires that were tested before 2023. Just go to the tire's review page, where you can find the old "test protocol" data next to the new "current protocol" data.
1.4.2 2014-2022 Inner Tube Protocol
MTB, CX/Gravel, Tour/E-Bike, and Fat Bike tires were always tested with a standard butyl tube regardless of whether their tire type was tubeless-ready or tube-type. There was an exception for tubeless, tubeless-ready, and tubeless-compatible road bike tires that were tested tubeless with sealant.
As this protocol became too confusing when comparing tires from different categories, we moved to a new protocol at the start of 2023, which treats all tires the same regardless of their category.
1.5 MTB Tire Pressures Update
NOTE: As of September 2025, the MTB section has become a multiple tire size category and the tire pressures have changed.
Mountain bike tire pressures are now aligned with the CX/Gravel section, and new tires are tested using the "Extra Low", "Low", "Medium", and "High" air pressures. The actual test pressures depend on the measured casing size and can be found in the test results table.
To facilitate easy comparison, we interpolated/extrapolated historic rolling resistance data for tires tested before September 2025. We extrapolated the lowest rolling resistance using data collected from 15 mountain bike tires that we tested at both the old and new air pressures. Ultimately, this is less accurate than testing all tires at the new air pressures, but we believe it's the best compromise going forward.
We've been testing mountain bike tires since 2014, and at that time, the very low air pressures weren't that common yet. Luckily, we tested all tires at four different air pressures from the start, which made this change possible. With today's knowledge, we would have done things differently.
For tires tested before September 2025, Pro Members can still access the historic data through the tire's review page.
2. Puncture Resistance

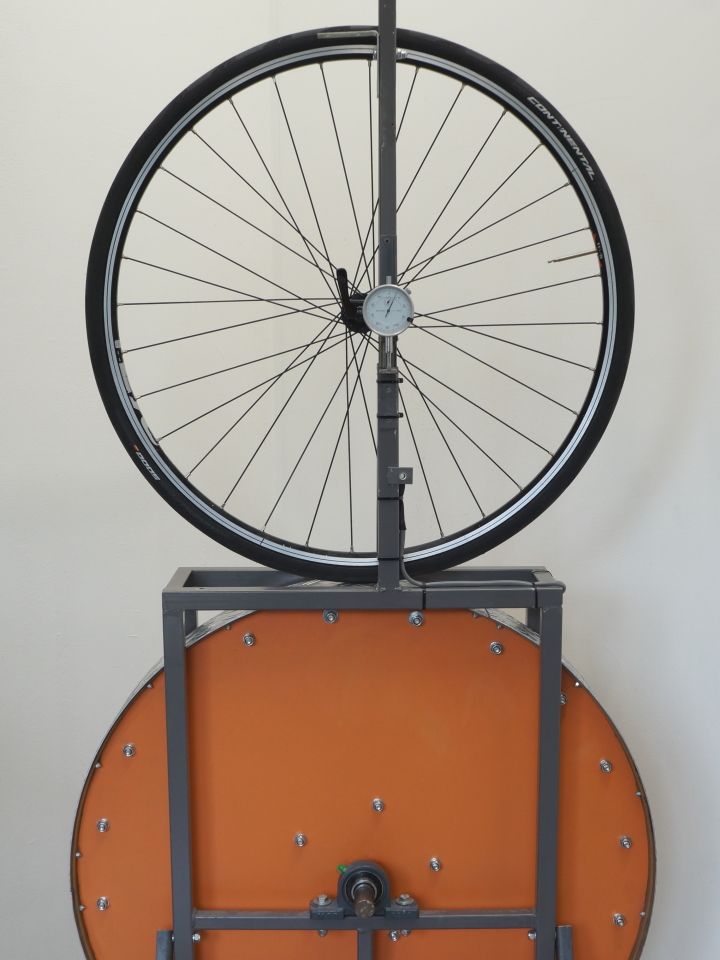
All our puncture resistance test results can be compared directly to each other as they are the same tests for road bike, mountain bike, gravel bike, fat bike, or touring bike tires.
2.1 Total Puncture Score
As of 2021, we've improved the puncture resistance tests and now provide 'Total Puncture Score' as the main puncture resistance indicator.
Total Puncture Score consists of Puncture Force Sharp Needle, Puncture Force Blunt Needle, and Total Tire Thickness. This value will give the best indication of real-life puncture resistance.
After testing a lot of tires, we found that casing material and anti-puncture strips take a lot of force to puncture. The rubber, on the other hand, doesn't take much force to puncture as it's a very soft material. We also found that a tire without an anti-puncture strip, that does have a thick layer of rubber doesn't take a very large force to puncture. In reality, it does offer a lot of puncture protection because the thick layer of rubber simply doesn't allow the object to reach the inner tube.
Furthermore, we found that the hardness of the rubber does make a difference to the required force and our force tests capture some of the differences in rubber compounds. We also found that the thickness of the tire is even more important on tubeless tires as re-sealing after a puncture works better when there is more material for the sealant to hold on to.
Total Puncture Score is calculated by adding the puncture force sharp and blunt needle scores and then adding 50% of that score for every mm of tire thickness. To calculate Total Puncture Score (TPS) the following formula is used:
TPS = sharp + blunt + ((sharp + blunt) * thickness * 0.5)
This website was started in 2014 and we haven't been able to re-test all tires with the blunt needle. We analyzed the data of 75 tires (tread + sidewall = 150 tests) that were retested with the blunt needle to be able to estimate the Total Puncture Score of tires that only have sharp needle and tire thickness measurements.
2.2 Puncture Force Tests
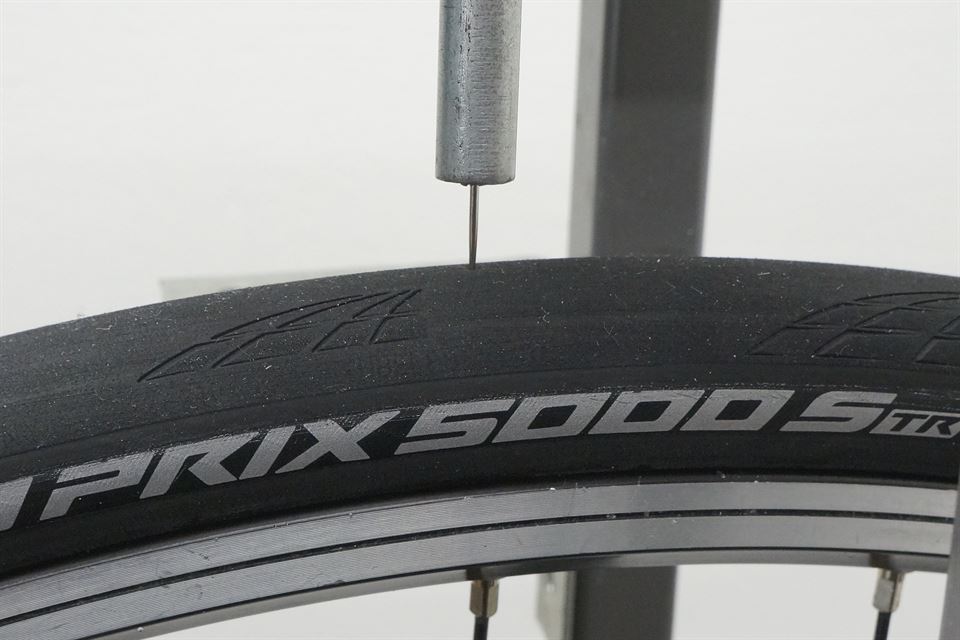
The puncture force tests are performed with steel needles to which weight can be added. The needles get positioned at the center of the tread for the tread puncture test and on the sidewall for the sidewall puncture tests. More weight gets added until it punctures the tire.
We use both a needle with a sharp tip and a needle with a blunt tip to simulate different punctures. We puncture the tires 5 times with both the sharp and blunt needle in both positions for a total of 20 punctures (inner tubes filled with sealant). The large amount of punctures results in a low margin of error as opposed to a big puncture that is done just once.
2.3 Puncture Factor
As of 2021, 'Puncture Factor' has been deprecated and is replaced by 'Total Puncture Score'.
3. Static Grip Test

The static grip test was introduced in November 2021 and is our latest test.
The grip test tests the static wet grip of both the center and the edge of the tires. On our website you can also find "average grip" which is the average value of the center and edge grip combined:
Average Grip = (center grip + edge grip) / 2
The scoring system in "Points" is simply the coefficient of friction multiplied by 100:
Grip in Points = coefficient of friction * 100
We have a special article dedicated to the grip test which includes much more information about the test: Introducing Grip Testing
3.1 Static Grip Test and Off-Road Tires
It's critical to understand our static wet grip test works with a hard surface. This means the grip data is only directly useful for comparing tires on hard surfaces where the rubber compound creates the grip. Understanding the test results gets more difficult when grip is created by the knobs digging into the surface.
On soft surfaces (loose sand, grass, etc), almost all grip will be created by the knobs digging into the surface, and our test results will be of little use.
There will also be many surfaces where the total grip will be a combination of the tread compound grip and the grip provided by the knobs. Under these circumstances, the hard surface grip can still be a deciding factor.
Given these shortcomings, we feel our grip test, combined with the knob height measurements, will still be valuable information when comparing tires.
3.2 How a Knobby Tread Affects the Test Results
A knobby tread reduces the grip in our hard surface test as the knobs reduce the contact area when compared to a "slick" tire. The wider the spacing between the knobs, the bigger the reduction in contact area and the harder it gets to score well in the hard surface test.
We also see a reduction in grip when the knobs are too flexible. On average, the higher the knobs, the more flexible they become, and the flexing under pressure reduces the grip on hard surfaces. For a knobby tire to grip well on a hard surface, the knobs should have enough "structural integrity" to overcome the forces experienced during the grip test.
These outcomes also show the limitations of the grip test when it comes to softer surfaces, as big and widely spaced knobs are precisely what you need to provide grip on soft surfaces where the knobs dig into the surface to create grip.
We always have to consider the tread pattern when judging the grip of an off-road tire.
